Eclipse seeks long-term capital appreciation from fundamentally sound or credibly improving businesses mispriced during temporary crises or market dislocations.
A severe price decline alone is not an investment thesis.
Eclipse looks for a temporary dislocation with credible business survival, a realistic recovery path and a price that leaves room for uncertainty. This includes improving businesses and credible turnarounds, as well as businesses whose underlying quality remains intact.
Price declines of approximately 50–99% provide context for the crisis situations we research. The size of the fall is a starting point for investigation, never a sufficient reason to buy.
Permanent impairment, unrecoverable governance failure and structural decline can make a low price misleading. The distinction rests on evidence about the business.
Why crisis investing is hard
The price can look compelling long before the outcome becomes clear.
Forced selling, liquidity stress and fear can push prices away from business value. But the same falling share price can also signal a business that will never recover. Distinguishing the two requires judgement while information is incomplete and uncertainty is high.
Even a surviving business may need years to recover. Further declines can test both the investment thesis and the ability to keep holding. A cheap entry price does not remove the risk of permanent loss.
16%
Recovered their prior high
Of stocks with a 95–100% maximum drawdown. Among those that recovered, the average time from trough to that high was eight years.
Historical context, not Eclipse performance or a forecast. The study excludes companies delisted for cause or bankruptcy, ADRs and stocks below its size threshold.
Share of stocks that recovered their prior high
By maximum drawdown · U.S. stocks, 1985–2024
Drawdown0100%
0–50%
80%
50–55%
77%
55–60%
74%
60–65%
67%
65–70%
67%
70–75%
62%
75–80%
54%
80–85%
49%
85–90%
42%
90–95%
37%
95–100%
16%
View historical drawdown and recovery data
U.S. stock drawdowns and recoveries, 1985–2024
Maximum drawdown
Average peak to trough (years)
Recovered to prior high
Average trough to prior high (years)
95–100%
Peak to trough6.7
Recovered to prior high16%
Trough to prior high8.0
90–95%
Peak to trough4.3
Recovered to prior high37%
Trough to prior high5.8
85–90%
Peak to trough3.7
Recovered to prior high42%
Trough to prior high4.6
80–85%
Peak to trough3.2
Recovered to prior high49%
Trough to prior high4.2
75–80%
Peak to trough3.1
Recovered to prior high54%
Trough to prior high3.8
70–75%
Peak to trough2.5
Recovered to prior high62%
Trough to prior high3.4
65–70%
Peak to trough2.3
Recovered to prior high67%
Trough to prior high3.2
60–65%
Peak to trough1.9
Recovered to prior high67%
Trough to prior high2.5
55–60%
Peak to trough1.7
Recovered to prior high74%
Trough to prior high2.2
50–55%
Peak to trough1.4
Recovered to prior high77%
Trough to prior high2.0
0–50%
Peak to trough1.0
Recovered to prior high80%
Trough to prior high1.5
Prior high means the price at the start of the maximum drawdown. Prices are intraday; the sample covers NYSE, NASDAQ and NYSE American stocks that continued trading after their maximum drawdown and reached a market capitalisation of at least US$1 million in 2024 dollars at a month-end. Recovery times describe only stocks that returned to their prior high.
These three lenses help us distinguish an investable crisis from a value trap. They bring together business survival, evidence the market may be overlooking and the relationship between upside and downside. They guide our judgement; they do not guarantee recovery.
Durability
Is this a price crisis or a business crisis?
We examine whether operations, the balance sheet and the competitive position can withstand the stress. A collapsing share price and a permanently damaged business are different problems. Where the business itself is in crisis, we look for credible evidence of stabilisation or improvement.
Divergence
What does the real world show that the share price does not?
We look for contradictions between the market’s expectations and evidence from the business: operating developments, customer and industry information, financial results and the recovery path. A different opinion matters only when there is evidence to support it.
Asymmetry
Does the potential reward justify the remaining risk?
We assess the margin of safety at the entry price, the value that recovery could realise and the downside if the thesis is wrong. The reward-to-risk ratio compares plausible upside with possible loss, rather than treating a return to the old share-price high as inevitable.
These lenses inform our Investment Process: Opportunity Screening, Deep Discovery Research and Valuation Realisation. Explore the process →
Research behind the judgement
An internal research community, supported by AI tools, connected knowledge and local information sources.
We use these inputs to find opportunities, challenge assumptions and investigate the business behind the share price.
200+
Deep-dive stock pitches each year
Across our internal research community.
Shared research
The internal research community brings together stock pitches and detailed company analysis, widening the set of businesses and investment arguments available for investigation.
AI-assisted discovery
ChatGPT and Claude support opportunity exploration and information synthesis. Obsidian helps organise and connect the research, notes and insights that accumulate around a business.
Local perspectives
Sources such as Xueqiu (雪球), the Chinese investor discussion community, provide ideas and local perspectives to investigate alongside company disclosures and fundamental research.
AI-assisted research
ChatGPT
Connected second brain
Obsidian
Local investor perspectives
Xueqiu 雪球
Product names and logos belong to their respective owners. Their use here does not imply endorsement of ABCD.
Reading beyond the price: Siloam Hospitals
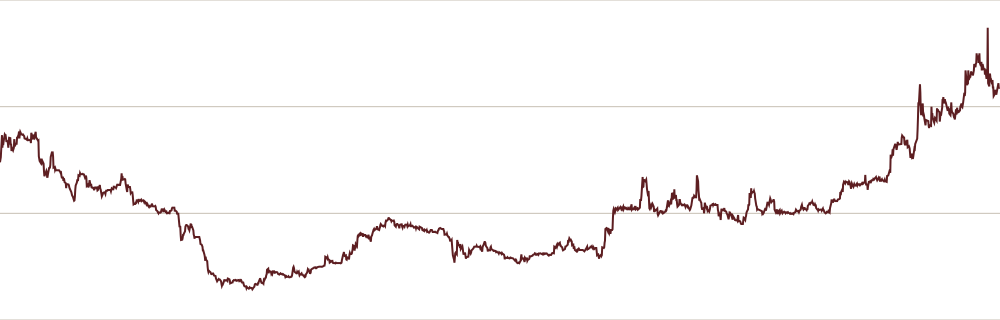
Indonesia · SILO · February 2017–December 2023
An educational market-history example prompted by Suthon’s personal investing experience. The chart shows the listed company’s share price, not ABCD or Eclipse performance, or a reconstruction of his transactions.
What was the crisis?
In October 2018, a bribery investigation into permits for Lippo Group’s Meikarta property project added to pressure on the group’s listed companies, including Siloam. The hospital operator’s association with Lippo put group-level governance and financial concerns alongside the question of how its hospitals were actually performing.
The investment question was whether those concerns meant lasting damage to Siloam’s business, or whether the share price had fallen further than its operating prospects justified. Patient demand and hospital activity needed to be assessed alongside ownership, financing and governance risks.
Historical context: Reuters, 18 October 2018; Liputan6, 19 October 2018. The investigation concerned the property project. SILO’s decline had begun before October 2018; this event does not explain the entire fall shown below.
SILO daily closing price IDR per share · provider-adjusted
3,0002,0001,0000
Feb 201720202022Dec 2023
The decline into crisisThe longer view shows the fall from 2017 into the October 2018 low, before the subsequent recovery.
A recovery with setbacksThe 2020 retreat interrupts the recovery. The later price rise could not have been known at the outset.
A retrospective illustration of the three lenses, not an original dated research note. Full-year 2018 disclosures became available after that year ended.
Durability
Look at the operating network. Siloam reported 34 hospitals at the end of 2018 and 2.39 million outpatient visits that year. A functioning hospital network is evidence to investigate; it does not by itself resolve debt, governance or shareholder risk.
Divergence
Compare the price story with business activity. The company reported four hospital openings in 2018. Expansion and patient demand offer a different perspective on a falling share price, but new capacity still needs to become profitable.
Asymmetry
Test what could go wrong at the purchase price. Consider cash generation, liabilities, dilution and a recovery valuation together. A low share price does not cap further losses; position size limits portfolio exposure, not the stock’s downside.
Operating facts: Siloam 2018 Annual Report, pp. 19–20. This is a selected historical example viewed with hindsight, not evidence of typical outcomes or a recommendation to buy SILO.
Patient ownership. Active cash flow.
Hold for recovery. Seek cash flow along the way.
Options and share lending can contribute during the holding period.
Crisis-equity strategyInvest for business recovery
Write calls
Including covered calls
Option premiumsCovered-call upside is limited
Write puts
Obligation to buy if assigned
Option premiumsAssignment requires capital
Lend shares
Securities lending · SBL
Lending feesBorrower and recall risks remain
Potential cash flow while we invest
Read the mechanisms and tradeoffs
Use depends on the position and market conditions. Shares on loan are not assumed to be available to cover a call.
Short calls
Call writing, including covered calls against shares held in the portfolio, earns option premiums. A covered call exchanges some potential upside for income during the holding period.
The shares can be called away, and equity downside remains. An uncovered short call has a different risk profile, including potentially unlimited loss.
Short puts
Put writing earns premiums in exchange for taking on an obligation to buy shares at the agreed strike price if assigned. It is another way the strategy can generate option cash flow.
Assignment can require additional capital when a stock is falling. Losses can substantially exceed the premium received.
Securities lending (SBL)
Lending eligible portfolio shares to borrowers earns lending fees during the holding period. This adds a potential source of cash flow from stocks the portfolio continues to have economic exposure to.
Income depends on borrowing demand and lending terms. Counterparty failure and problems recovering the shares or realising collateral can cause losses.
Cash inflows are not guaranteed net returns. Costs and investment losses can outweigh premiums and fees.
Portfolio construction
Crisis equities remain the principal return engine.
Tactical instruments and cash support the equity mandate. Covered options may overlap with shares already held; securities lending also uses portfolio holdings rather than representing a separate allocation sleeve.
Allocation ranges, not current portfolio weights.
050100%
Crisis Equities
70–85%
Researched positions in businesses affected by temporary crises or dislocations.
Tactical Instruments
0–15%
Options and other instruments for income, specific opportunities and exposure management.
Cash & Risk Management
5–20%
Liquidity for new opportunities and changing risk conditions.
Cash may exceed its normal range when opportunity or risk conditions warrant. Ranges move with the opportunity set and are not fixed weights or a current allocation.
Risk remains part of every decision
Research continues through the holding period. Eclipse does not publish a numerical portfolio drawdown limit or offer capital protection.
Maximum single position
20% of Eclipse Fund NAV
Portfolio size
20–30 securities, approximately
Market and concentration
Position limits constrain individual exposure but do not prevent correlated declines or broad equity losses.
Permanent loss and thesis failure
A failed recovery or business deterioration can invalidate the thesis and lead to severe further declines.
Options, lending and leverage
Assignment, volatility, lending and transaction costs create risk; derivatives can add economic exposure even though borrowing leverage is not a primary tool.
Liquidity and execution
Listed shares can become difficult or costly to trade in stressed markets.
Operations and counterparties
Custody, clearing, lending or counterparty failures can affect the portfolio independently of the thesis.
Review, resize or exit
Eclipse reduces or exits when fair value is reached, the thesis completes or breaks, business quality worsens or capital has a better use. Decisions remain thesis-based, with no fixed maximum holding period while the case holds.



 ChatGPT

 Obsidian